
Are you leveraging time-tracking to boost your agency’s profitability?
Yes, should be the only answer here, as it is one of the only ways to ensure profitability within different teams and the company itself.
But even if you are making great strides when it comes to time tracking and ensuring it is well-spread throughout your company all the way to individual levels, things still might fall through the cracks. After all, the responsibility of time tracking falls on those who are utilizing the time.
What we wanted to find out was how digital agencies use time-tracking data to enhance profitability and resource utilization. This is why we teamed up with Databox and created a benchmark group exclusively for Digital Agencies.
With this live, always-up-to-date benchmark study, you have the opportunity to anonymously see how you stack up against time-tracking metrics of other digital agencies. We chose to go with Harvest as the best integration to get us the metrics we need.
Our benchmarks group has 35+ members and is continually growing. By joining, you will have access to meaningful insights into how you are performing across the board. You can easily discover in which metrics you are leading and in which you are underperforming. This can help you make educated decisions regarding your agency’s growth.
Members of the group can even track their performance vs. the benchmark over time, making it easy to see progress or the lack thereof.
The best part is that it’s 100% anonymous and 100% free, which means that you can compare your or your client’s data to similar companies without worrying about anyone sharing it.
To help you really see the value, we’re sharing some of the data below, for October 2023.
The chart below is dynamically generated by Databox’s free benchmarking software. If you are okay with just a bit of statistics, they will be pretty easy to comprehend. However, if you’re not used to looking at them, they can seem a bit overwhelming. But we are here to help, and once you get the hang of it, you will be able to understand each chart by just glancing at it.
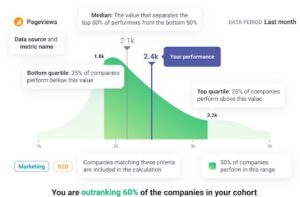
This chart shows an example of what you will see once you join a group. It shows a fictitious company’s performance against a sample of companies.
The blue vertical line represents a company’s performance in the previous month. For this company, it shows 2,400 Pageviews. The chart also shows the following:
Now that you know how to read the graphs, we’ll share some of the actual data from our group below.
You can always join the group for access to the rest,and to see up-to-date data and historical benchmarks too.
For our benchmark group, we focused on time-tracking metrics so that we could get further insights into the efficiency and profitability of teams and companies from our industry. Within this group, we focus on data from the Harvest integration to give us a well-rounded view of our time-tracking data.
The group shares data on a total of 7 sales metrics. For this blog post, we will be looking at the following –
It is not just time-tracking that influences your profitability, however, we believe that it plays a big role, and these metrics help us tell the story.
So, let’s investigate.
According to our Benchmark Group, the median value for the billable amount metric for October 2023 is $69,687.34. The median value in our group that features over 35 members for Billable Hours is 842.13, while the median value for Non-Billable Hours was 625.33. Finally, the median value for Hours Tracked was 908.25.
Here’s a chart showing the distribution of Billable Amount values for one of the group members:
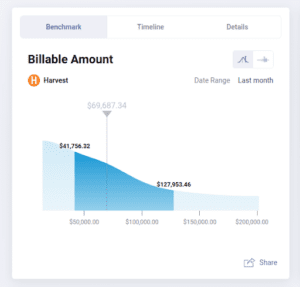
We removed our member’s name since these benchmark comparisons are anonymous and private to each company.
Now let’s see what else we can learn from this chart – For example, by the height of the blue area, we can see that most agencies are in the first 25%, so their billable amount falls between zero and $41,756.32. The 25% of the sample falls between $41,756.32 and the median value. So, those are all underperforming in comparison to the median.
On the right side of the chart, we can see that 25% of the sample has a Billable Amount between $69,687.34 and $127,953.46. And finally, we have the group that outperforms and has over $127,953.46. Based on this, we can conclude that there is only a small number of companies that outperform the median value for this metric.
Once you connect your data to our benchmark group, you might also see a green chart, which means that when you look at the numbers, you will see that you are doing better than half of the group. In a perfect world, all our charts in Benchmark Groups would be green.
However, there is a possibility of seeing a red one as well. This means that you are underperforming for that specific metric and this is an excellent indicator that you might want to take steps to improve that specific metric.
See how you measure by joining the group and connecting your Harvest data.
Please keep in mind that your stats will vary depending on your profitability and time-tracking efforts. But don’t get discouraged – simply dive into the insights and make the changes necessary to hit your goals.
Ready to see how your sales and marketing performance stacks up against this group of 35+ employee HubSpot customers?
Get full, free access just by signing up for our Databox-powered Benchmark Group or contact us if you’d like us to help you.
Either way, your data will be kept confidential, and your participation will only be known by us.
If you want to learn about the profitability landscape of digital agencies, join our – “The State of Profitability in Digital Agencies Survey” – and be the first to see the data it accumulates.